How it was made
Each page combines official cartography, municipal data, archives, scholarship and neighbourhood sources. Administrative boundaries organise the atlas; neighbourhood life often spills across them.
Figures always show their year. Historical claims link to the sources that support them. Where sources disagree, the disagreement is stated. Where the evidence is insufficient, the gap is left open.
Historical cartography in this atlas
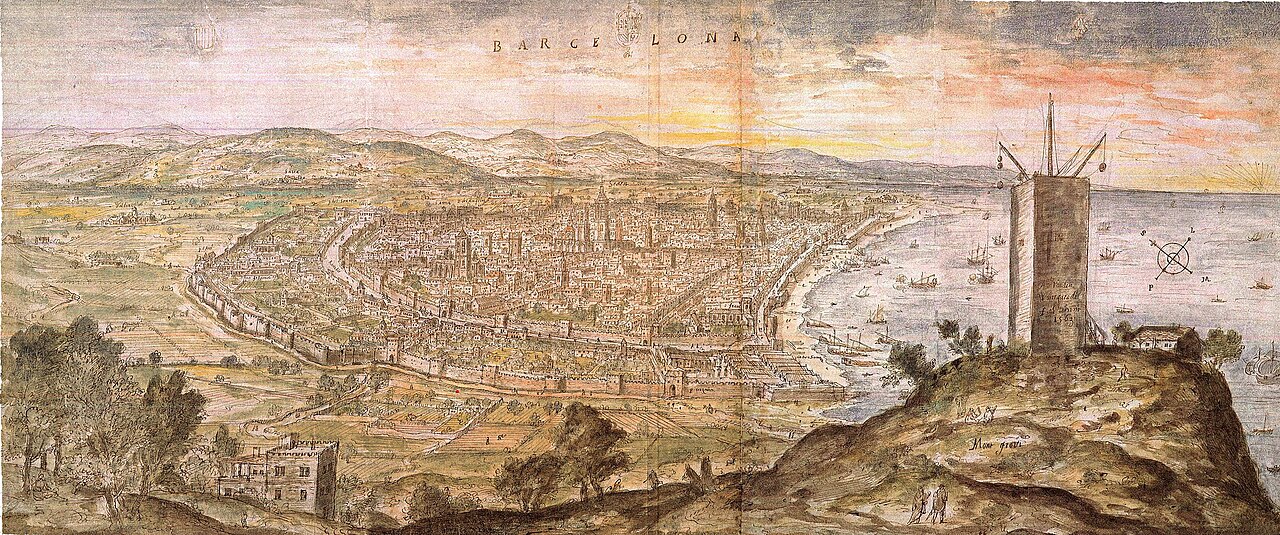
Panoramic view of Barcelona drawn by Anton van den Wyngaerde, 1563.
Wikimedia Commons · public domain · source

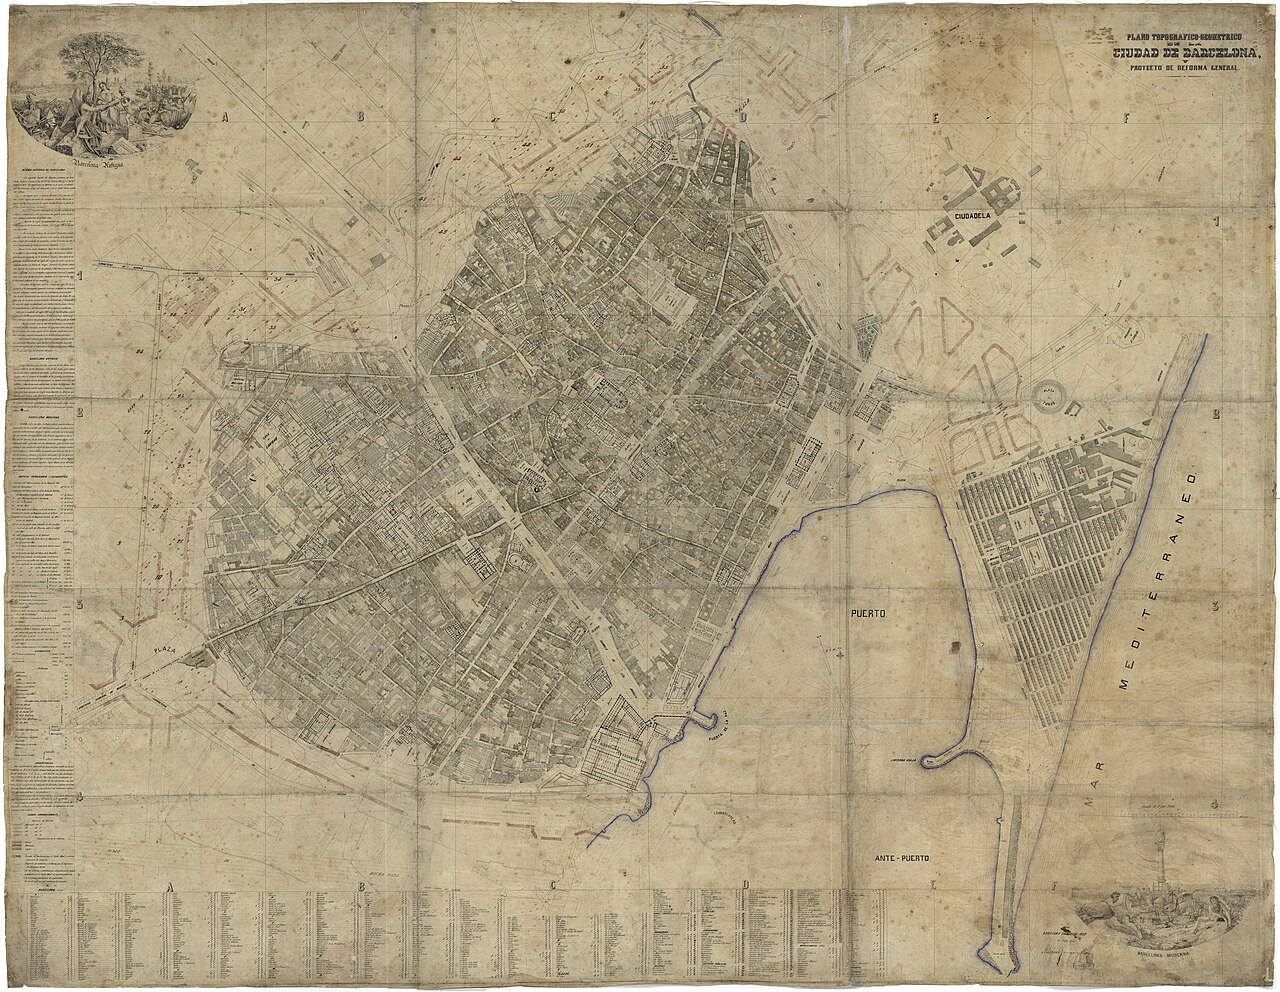
Plan of Barcelona shortly before Cerdà’s Eixample (1858).
Wikimedia Commons · Miquel Garriga i Roca · CC BY 4.0 · source

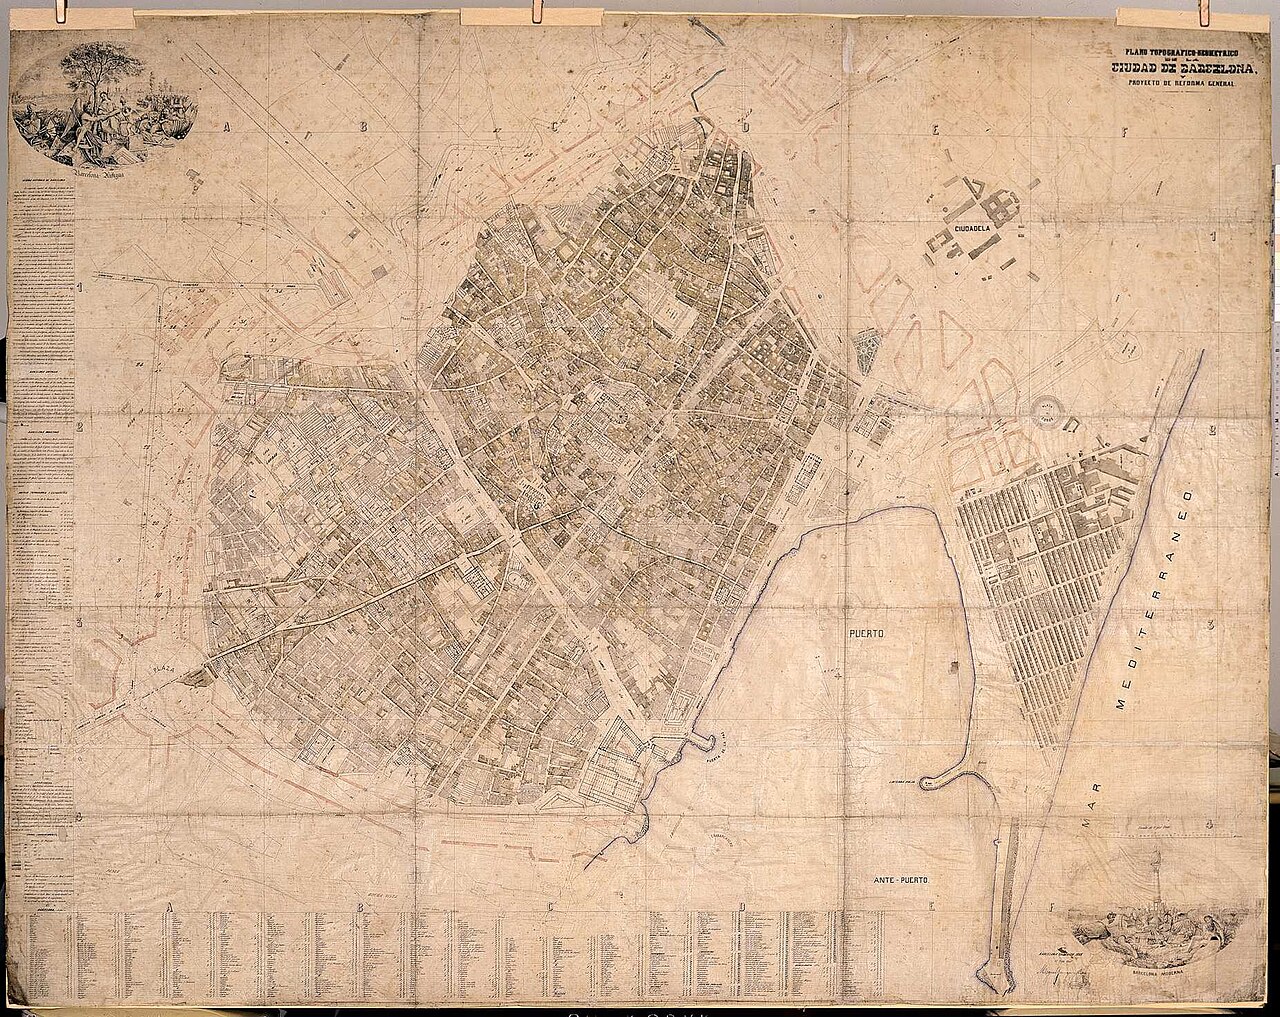
Plan by Miquel Garriga i Roca (1862), detailed cartography of the consolidated city.
Wikimedia Commons · public domain · source

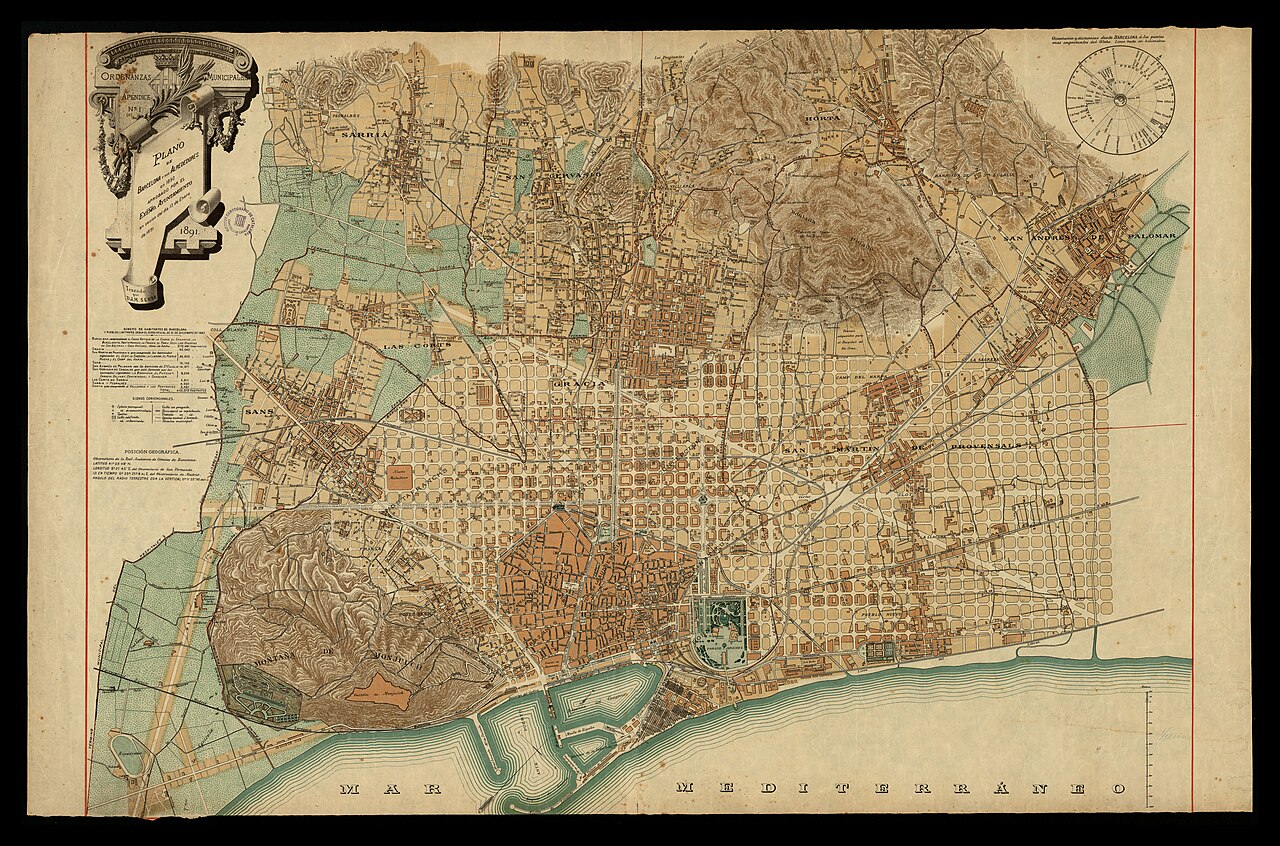
Plan of Barcelona and its surroundings around 1890, with the Eixample expanding.
Wikimedia Commons · public domain · source

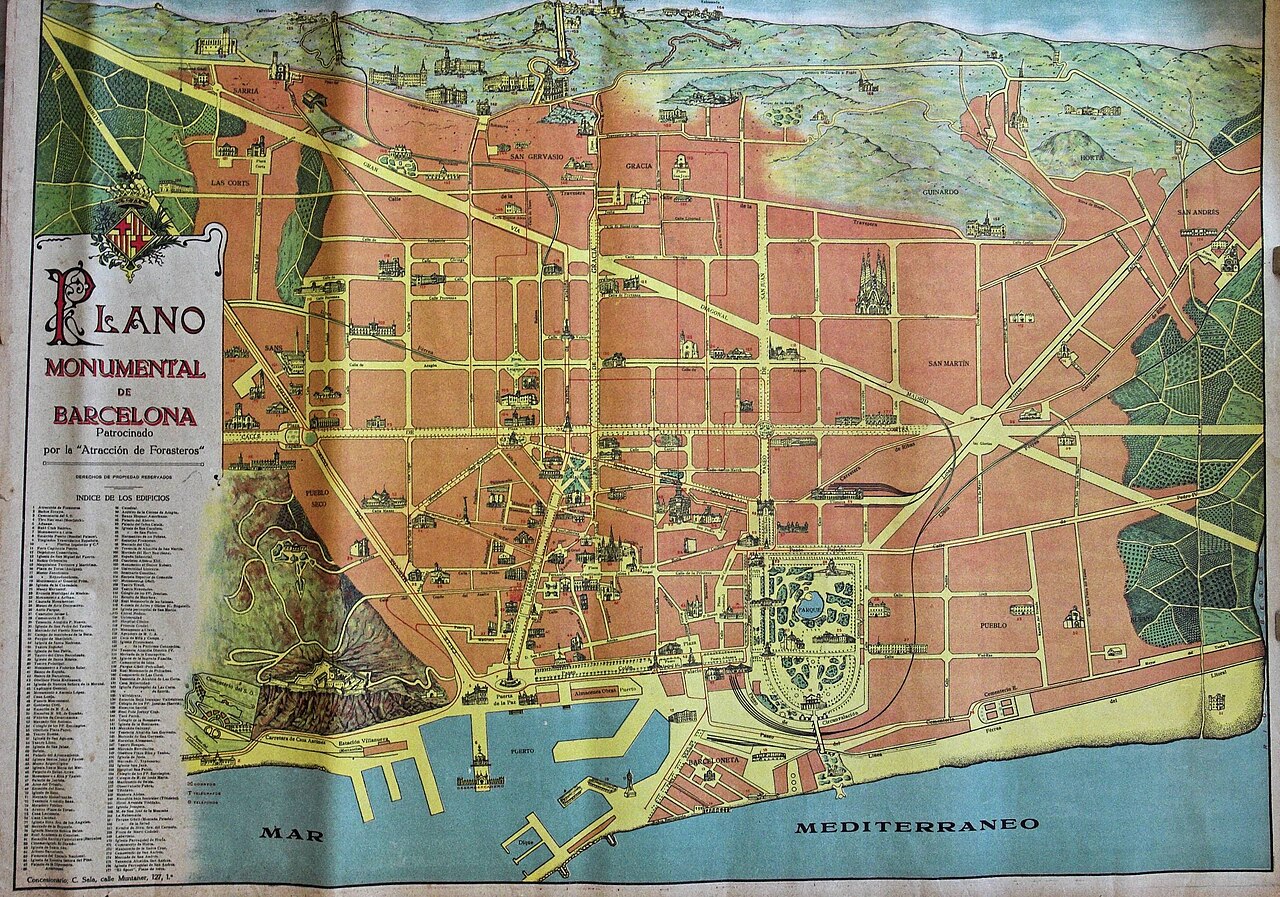
Map of Barcelona published in 1920, when the urban fabric was already much larger.
Wikimedia Commons · CC BY-SA 4.0 · source

Boundaries
The atlas uses Barcelona's 73 official neighbourhood units (2006) and CartoBCN cartography. Administrative lines organise the map; lived neighbourhoods often cross them.
Historical evidence
We prioritise municipal archives, MUHBA publications, historical cartography and scholarly work. Where sources disagree, the page says so.
Figures
Population and non-Spanish nationality come from the 2026 municipal register. Area uses the official 2021 neighbourhood surface series; density divides 2026 population by that area. Income is the 2023 disposable household income per person indicator: we take the unweighted arithmetic mean of the census-section values assigned to each neighbourhood by the municipal dataset and exclude missing values. It is not weighted by people or households. Every figure shows its year and links to its source.
Routes
Distances follow an OpenStreetMap pedestrian network calculated with OSRM and are rounded. Estimated visit time adds walking time and declared stop minutes; where stop time is not reliable, only walking time is published. The approach from public transport is excluded. A route is never described as accessible without a specific check; its review date refers to the route geometry, not the site build date.
Translations and review
The atlas is published in Catalan, Spanish, English and Romanian from one shared structure. Official Catalan names are immutable; facts, dates and source IDs are shared, while prose is localised. A data correction propagates to all four editions. Review dates belong to the specific content and do not necessarily mean a field visit.
Images and rights
Images appear only with documented source and licence.
Corrections
Send barcelona@mariuscomper.uk the page URL, disputed wording, proposed correction and a source. Each page shows its own review date; the footer shows when the site was last built. Last global review: 3 October 2026.